

Java is a widely used programming language, favored for its platform independence and robustness.
I learned to value the simplicity and elegance that comes with Java. The object-oriented model is stronger, simpler, and more valuable when you want to scale. The complexity needs to be in the API and the additional functionality and not in the language itself. That language should be fluid and easy.
– Shai Almog, Co-founder of Codename One, a software engineer, developer advocate, architect, entrepreneur, and author
However, even the most seasoned Java developers can run into issues with their code.
Debugging is an essential skill for any software developer, and Java programmers are no exception. It's crucial to know how to effectively identify and fix errors in order to save hours of frustration and ultimately result in better-performing applications.
In this blog, we will explore the best practices for debugging Java programs, including common debugging techniques, tools, and strategies to help you streamline the debugging process and achieve success in your Java projects.
Best Practices for Debugging Java Programs
1. Understand the code

Before you start debugging, it is important to have a good understanding of the code you are working with.
By thoroughly understanding the code and how it works, you can easily find the source of bugs and errors and determine the best way to resolve them. Additionally, understanding the code can help developers anticipate potential problems and implement preventive measures to avoid them.
Overall, having a solid understanding of the code is a key factor in improving the quality and reliability of Java programs, and reducing the time and effort required to debug and fix issues.
2. Use print statements
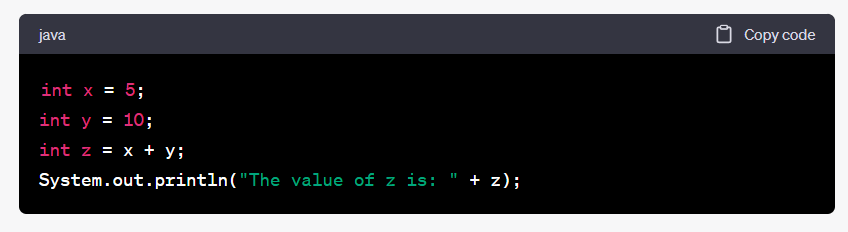
Print statements are a simple and effective way to debug Java programs, especially for beginners. It does not require any additional tools or setup and can be easily added and removed from the code.
By inserting them in strategic locations in the code, developers can track the flow of execution and observe variable values and expressions.
This helps to identify errors and bugs in the code and ensure that the program is producing the expected output.
However, it is important to use print statements judiciously and only for debugging purposes, as too many print statements can clutter the output and make it difficult to understand what is happening in the code.
Additionally, it is also important to remove all print statements before shipping the final version of the code.
3. Use the Eclipse Debugger
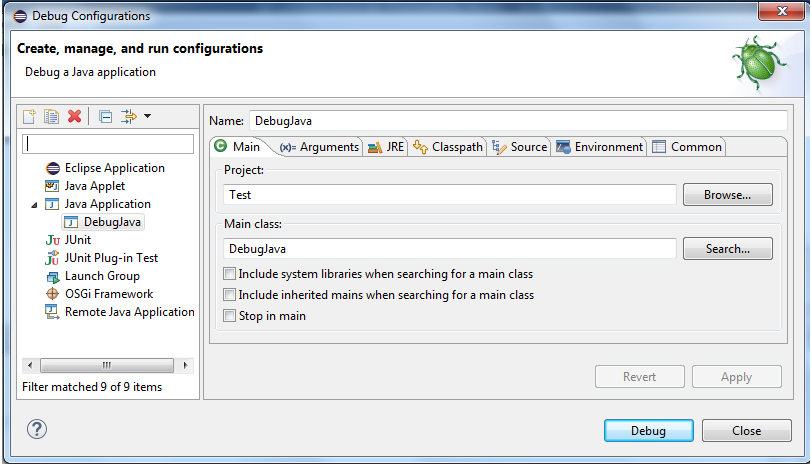
Eclipse is a popular Java development environment that includes a built-in debugger.
This tool allows you to step through your code, set breakpoints, and watch variables and expressions.
Using the Eclipse Debugger is an important best practice for debugging Java programs because it provides a number of powerful tools and features that can help you identify and resolve issues in your code more efficiently than relying solely on print statements, making it a valuable tool for any Java developer.
The Eclipse Debugger permits you to progress through your code one line at a time, analyze the values of variables, define stopping points, and scrutinize the program's status at any given moment.
4. Use the Java Debug Wire Protocol (JDWP)
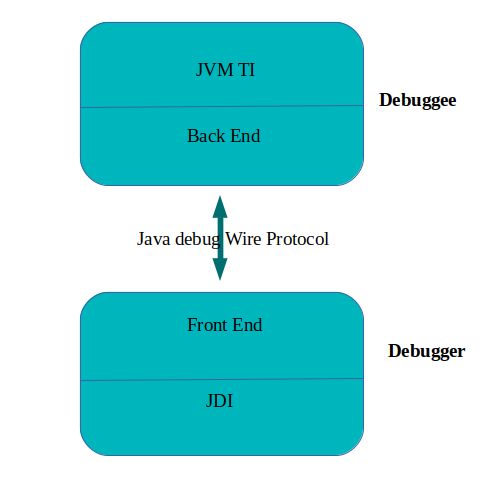
The Java Debug Wire Protocol (JDWP) is an important tool for debugging Java programs because it enables you to debug Java programs remotely.
By connecting a debugger to a running Java virtual machine (JVM), JDWP allows for real-time examination of a program's execution state.
This is especially valuable for distributed applications or when debugging on a different machine.
JDWP provides a standard set of commands that a debugger can use to interact with a JVM, such as retrieving the values of variables, setting breakpoints, and controlling the execution of the program.
By utilizing JDWP, you can enhance the effectiveness and efficiency of debugging your Java programs. This is achieved by providing you with improved insight into the program's status during runtime.
As a result, you can quickly detect and resolve errors, and boost the caliber and robustness of your code.
5. Use a profiler
A profiler assists you in gauging the execution speed of your Java program.
With the aid of a profiler, you can detect blockages in your code and enhance its efficiency.
The profiler accomplishes this by revealing the duration of execution for each method, the most frequently called methods, and the memory consumption.
It also provides detailed information about the performance of your code which can help reduce the likelihood of bugs and crashes.
Profilers also often have additional features, such as heap analysis, thread analysis, and performance testing, making them a valuable tool in the debugging process.
Tools for Debugging Java Programs
1. JDB
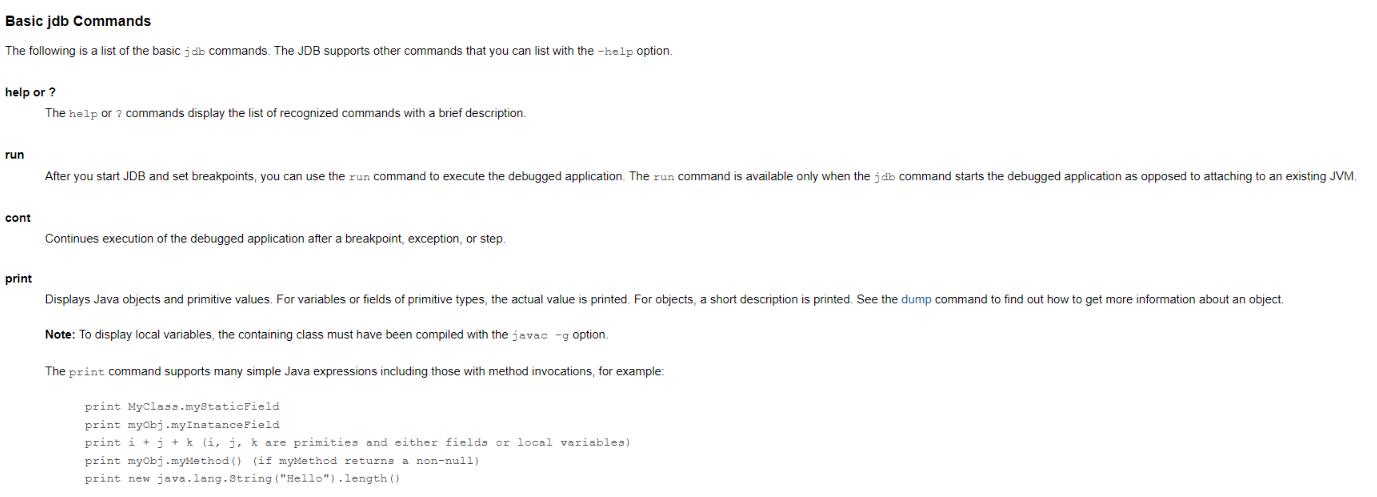
JDB is a debugger for Java programs that operates via command-line interface.
It enables you to progress through the code, establish stopping points, and scrutinize the status of the program at any stage during its execution.
It can be used to debug both local and remote Java applications, which can be useful when working with distributed applications or when debugging a program running on a remote machine, and supports advanced features such as conditional breakpoints, watchpoints, and thread-specific debugging.
JDB is a powerful tool for debugging Java programs.
However, it requires a certain level of familiarity with the Java programming language and the JDWP protocol and does not have a graphical user interface making it less user-friendly for some developers.
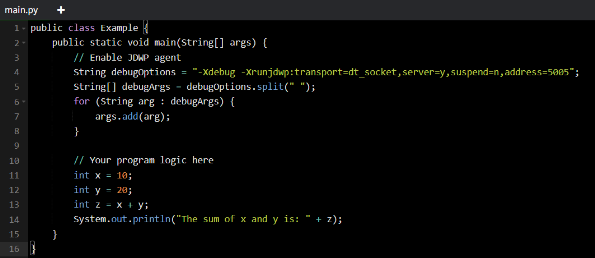
In this code, we enable the JDWP agent by passing the -Xdebug and -Xrunjdwp options with specific arguments to the program. After this, we have some program logic that adds two numbers and prints the result.
To use JDB with this program, we would start the program using the above code and then use the following command to connect JDB to the running program:
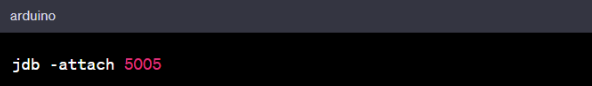
Once connected, we can use various JDB commands to control the program's execution and examine its state. For example, we can use the stop at command to set a breakpoint at a specific line of code and step command to step through the code one line at a time. We can examine the value of a variable at any point in the execution using the
print command, and we can see the current call stack using the where command.
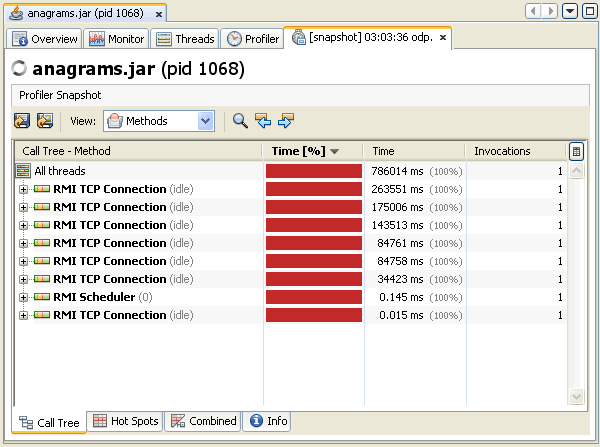
2. JVisualVM
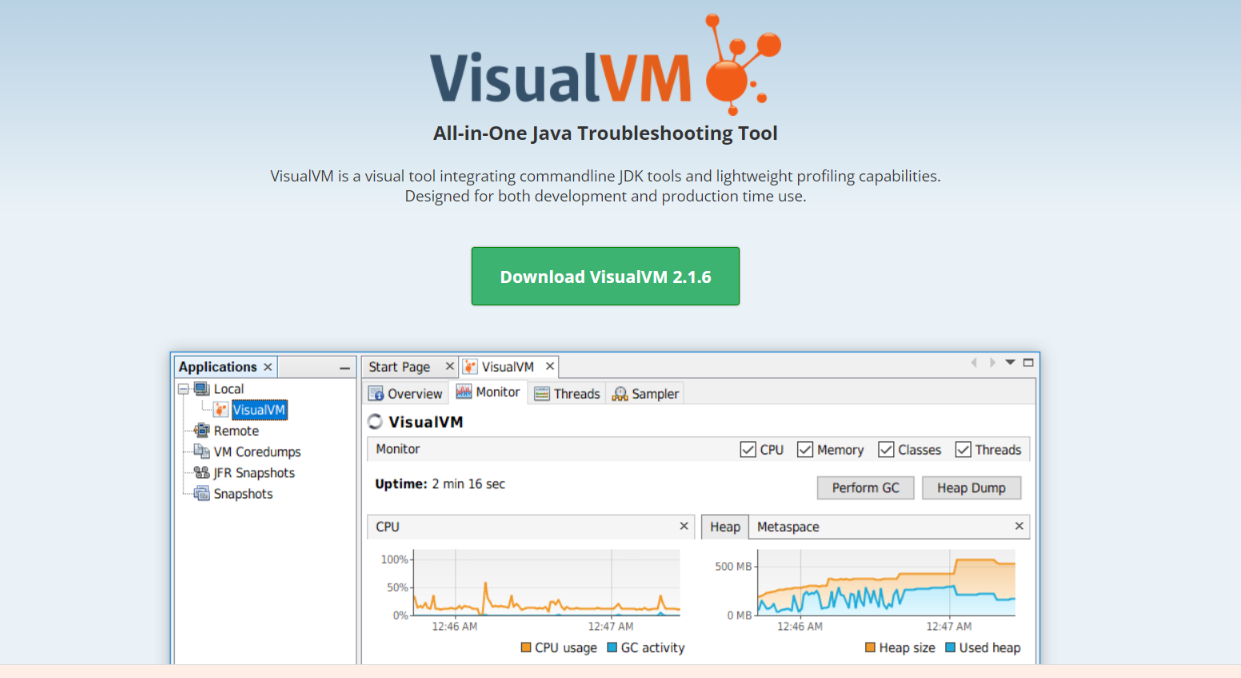
JVisualVM is a visual tool that comes with the Java Development Kit (JDK) for monitoring and profiling Java applications.
One of the key features of JVisualVM is its ability to provide a visual representation of the performance of your program.
It allows you to view the heap and permgen memory usage, monitor CPU and garbage collection activity, and track thread usage.
With this information, you can identify performance bottlenecks and optimize your program's performance.
With JVisualVM, you can conduct detailed memory analysis of your program using the heap dump analysis feature.
It also enables you to track your program's thread state using the thread dump analysis feature and manage JMX MBeans with the MBean browser feature.
JVisualVM's ability to profile method performance and monitor remote Java applications makes it a valuable tool for debugging distributed applications.
3. Yourkit
If you are looking for a powerful and reliable profiler for your Java programs, YourKit is the ultimate tool for the job.
With YourKit's advanced features like memory and CPU profiling, you can perform an in-depth analysis of your program's performance.
This helps you to quickly identify concerns such as sluggishness and memory leakage, and other complications that have the potential to impede or disrupt the operation of your application.
YourKit's user-friendly interface provides real-time performance metrics, memory usage, and thread activity information, making it easy for both experienced and novice Java developers to identify and resolve performance issues with just a few clicks.
It supports multi-threaded applications, enabling monitoring of all threads to identify and resolve performance issues caused by race conditions or synchronization problems.
It also supports Java frameworks like Spring and Hibernate, making it easier to identify and resolve performance issues specific to these frameworks.
Whether you are developing a desktop application, a web service, or a complex enterprise system, YourKit will help you to ensure that your program is performing optimally and that your users are getting the best possible experience.
4. FindBugs
FindBugs is a widely used static code analysis tool for Java that detects potential bugs by analyzing bytecode.
It can identify and report various bugs such as null pointer exceptions, uninitialized variables, and resource leaks.
One of the best features of FindBugs is that it is an open-source tool that is free to use.
This means that you can use it without having to spend any money on expensive commercial tools.
It is also highly customizable, allowing you to configure it to suit your specific needs.
Another great feature of FindBugs is that it integrates well with popular Java development environments such as Eclipse, IntelliJ, and NetBeans.
By integrating FindBugs into your preferred IDE, you can conveniently utilize the tool without any difficulty.
In addition to finding bugs, FindBugs also provides detailed information about each bug that it detects which can help you quickly identify and fix the bug.
This includes a description of the bug, the location in your code where the bug occurs, and the severity of the bug.
Its ability to detect a wide range of bugs and provide detailed information about each bug makes it an essential tool for any Java developer.
So, if you want to make bug hunting easier and more efficient, give FindBugs a try!
5. Log4J
Log4j is an open-source logging library for Java-based applications.
It was developed by the Apache Software Foundation and is part of the Apache Logging Services Project.
One of the key features of Log4j is its ability to allow developers to specify the logging level for their applications.
This means that developers can choose to log only errors, warnings, or informational messages, and can suppress less important messages.
Another important feature of Log4j is its flexibility in terms of output. Log messages can be directed to various appenders, including the console, a file, or even a database.
This allows developers to easily customize the logging output to meet their specific needs.
In addition, Log4j provides support for the use of markers, which are labels that can be added to log messages for easy filtering.
This makes it easier for developers to locate and isolate specific messages.
Overall, Log4j is a powerful and flexible logging tool that has become an essential part of many Java-based applications.
Whether you're developing a simple application or a large, complex system, Log4j can help you keep track of what's happening and diagnose issues when they arise.
Conclusion
In conclusion, debugging Java programs can be a challenging task, but with the right set of tools and best practices, it can be made much easier.
By following these practices and using the tools listed, Java developers can save time and effort in identifying and fixing bugs in their code, resulting in more efficient and reliable applications.
Want to know why Java is still so popular among developers? Read here to know more about the factors that contribute to its ongoing success and increasing favor among developers.
Listen to the Mangtas Nation podcast episode with Shai Almog, the Co-founder of Codename One, a software engineer, developer advocate, architect, entrepreneur, and author, as we explore the essential subject of effective debugging on a large scale and its significance in the field of software development.